Coordinates: Read the Horizontal Value Before the Vertical
An ordered pair describes a position relative to an origin and two axes. Its order, scale and signs matter. Build a consistent plotting routine before connecting points into a graph.
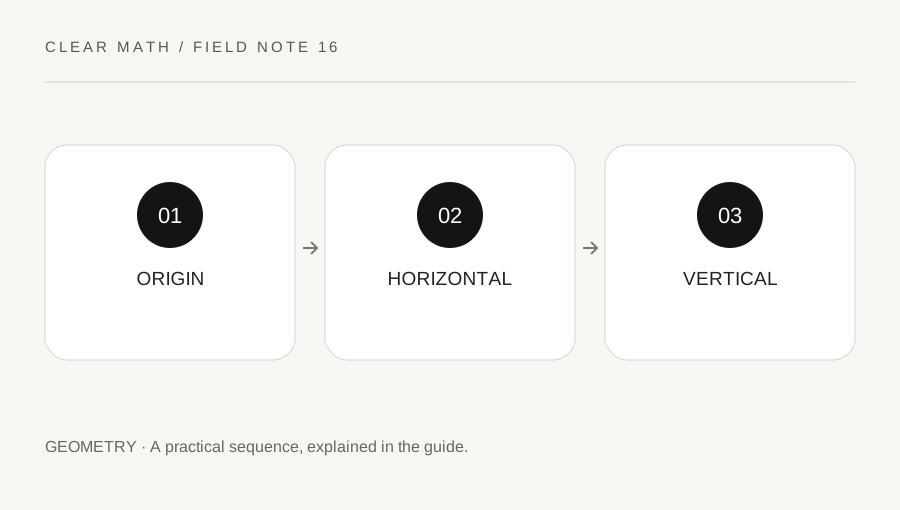
Original explanatory diagram. Numerical examples in this guide illustrate the reasoning; they are not a claim of hands-on testing.
Read an ordered pair as two positions
The point (3, 2) has horizontal coordinate three and vertical coordinate two. Start at the origin, move three units right and two up. The point (2, 3) is different: entry order matters. Label the axes x and y so the convention remains visible.
Negative horizontal values move left, and negative vertical values move down. Thus (−4, 1) is four left and one up, while (1, −4) is one right and four down. The point (0, 0) is the origin, where the axes meet.
Coordinates refer to a chosen system. A diagram can use different units or a shifted origin, so read the labels instead of assuming every grid has identical spacing or represents physical distance in the same way. Record each complete ordered pair beside its point to make a later reverse check possible.
Check scale before counting squares
If the horizontal axis shows zero, two, four and six at successive grid lines, one interval represents two units. A point on the third positive line has horizontal value six. The vertical axis may use a different scale, especially in a data graph.
Write the value of one interval beside each axis before plotting. Locate the coordinate values rather than just counting printed boxes. A stretched graph can make a line look steeper without changing the data values, so visual angle alone is not a reliable numerical comparison.
For introductory exercises, equally spaced numerical intervals make plotting straightforward. A broken axis or a non-linear scale needs additional interpretation. Do not transfer simple square counting to such a diagram without reading its notation. A ruler can help locate a mark, but it cannot supply a missing scale or unit label.
Use signs to identify regions and axes
Quadrants are commonly numbered counterclockwise from the upper-right region. In I both coordinates are positive; in II x is negative and y positive; in III both are negative; in IV x is positive and y negative. Axis points are not inside a quadrant.
For (0, 5), the horizontal coordinate is zero, so the point lies on the vertical axis. For (−3, 0), it lies on the horizontal axis. A zero coordinate does not mean the point disappears; it gives its exact position on an axis.
Reflection provides a check. Reflecting (3, 2) across the vertical axis gives (−3, 2), while reflecting across the horizontal axis gives (3, −2). Only the coordinate perpendicular to the mirror changes sign. Draw the mirror axis and compare equal distances on opposite sides if the sign rule feels abstract.
Connect plotting to a relationship
Plot (0, 1), (1, 3), (2, 5) and (3, 7). Each follows y = 2x + 1. As x increases by one, y increases by two. A continuous algebraic graph includes the intervening line, while a context involving counts may allow only discrete points.
Practice with A(−2, 3), B(4, 3) and C(4, −1). A and B share y, so their segment is horizontal. B and C share x, so their segment is vertical. These axis-aligned distances are six and four coordinate units when the axis units are compatible.
Read the coordinates back from your plot. This catches swapped entries and wrong scales. Say “horizontal first, vertical second” until the routine is dependable, then focus on what the set of points represents. Connecting every pair without checking the context can create a misleading graph even when the individual points are plotted accurately.
A practical checklist
Tick items for your own use. This checklist is saved only in this browser.
Questions that come up
Is (a, b) always different from (b, a)?
They are usually different, but coincide when a equals b. Ordered-pair notation preserves which entry belongs to each axis.
Does an axis point belong to a quadrant?
No. Quadrants are the regions between the axes. A point with a zero coordinate lies on an axis.
Should every set of points be joined?
No. Connect them only if the mathematical relationship and context support the intervening values. Discrete counts and continuous functions can need different displays.
References & scope
Background references checked on 18 October 2026. The examples and practice exercises are original editorial explanations, not copied procedures or professional advice.